Nate's Thoughts
- I figured out how to shell into a claude thread from my phone. I sat in bed and chatted with Claude while watching TV on this one. Mind blowing.
- I used Docling to parse the API docs into markdown as a source of truth for the robot. The parsing did OK, but struggled with tables spanning multiple pages.
- Something wasn't working with the signing of the request, and i told claude to test it (instead of me refreshing the page over and over). I need to add this to my initial prompting as it was able to figure out the issue on it's own.
- This is using a SQLite DB locally, which was a pattern I learned about at the end of last year. It was one of my favorite things to learn last year, and inspired me to to this Good Vibes Only project this year because I had an option for deploying data persistance to my practically free PHP and Apache on Dreamhost account.
- Per project 001's recommendation, I provided claude a screenshot of the desired output. I think it helped. It was able to get the colors to match the same, and the layout is roughly the same. I think in the future I should encourage the robot to use CSS frameworks. Maybe? I dunno. The minimal CSS / class names are kind of cool.
- Late note: my SQLite db had to be initialized via SSH. This was doable, but not ideal. Previously my PHP script had done this as part of a check in the PHP file. Maybe not ideal for big complicated systems, but for me, this is fine.
- Late note: I also created a social media agent for this to generate my meta tags and a prompt for the OG image. Maybe in the future I can have it use a tool call or something to fully generate the image for me!
Project Overview
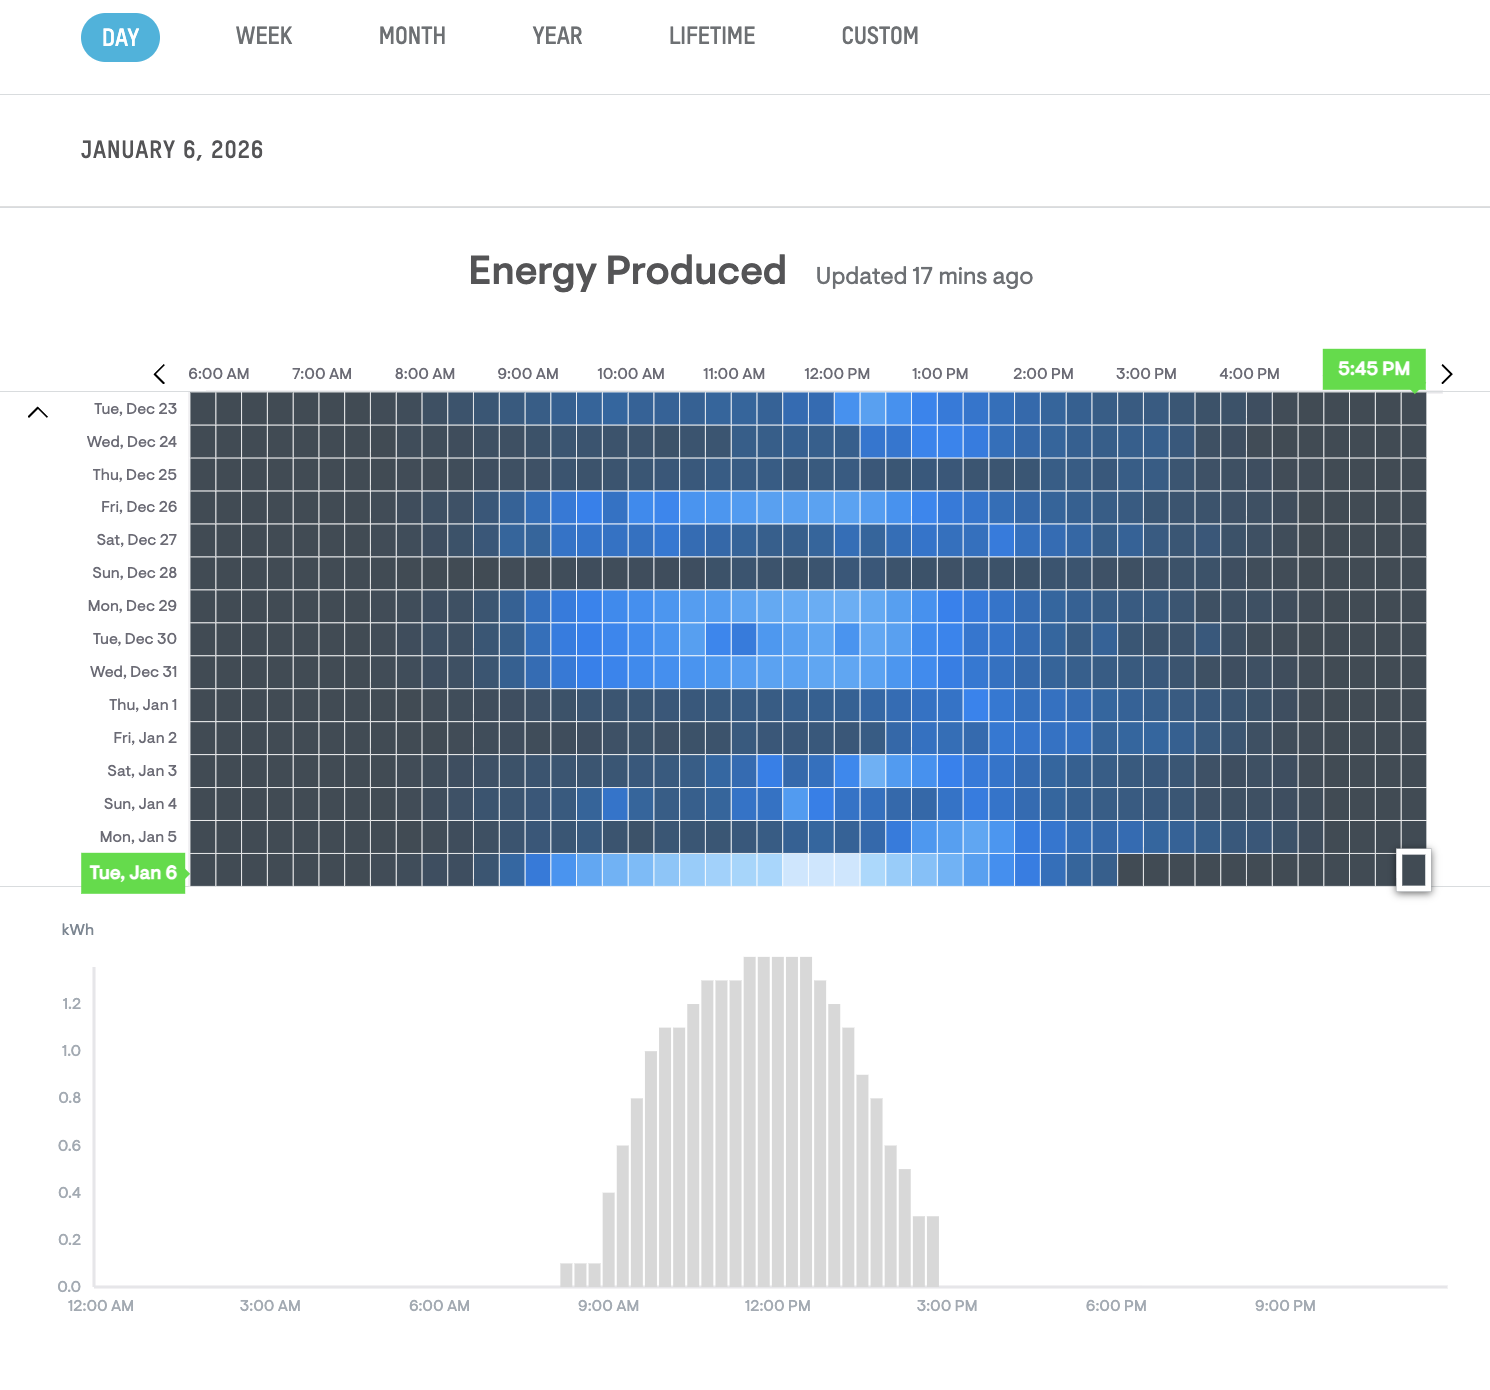
This solar energy dashboard was built to visualize hourly energy production data from an APsystems ECU in a heat map format inspired by a friend's system display. The project demonstrates full-stack development with Claude Code, including API authentication, database caching, security hardening, and interactive data visualization.
AI Agent Used
This project was developed entirely using Claude Sonnet 4.5 (model ID: claude-sonnet-4-5-20250929) through the Claude Code CLI interface. The AI agent handled:
- Requirements gathering and clarification
- Product requirements documentation
- Full-stack implementation (HTML, CSS, JavaScript, PHP)
- Security configuration and testing
- API integration with HmacSHA256 authentication
- Database schema design and implementation
- Debugging and troubleshooting
- Comprehensive documentation
Token Usage
Development of this project consumed approximately 30k-35k tokens from the Claude Code session, including all conversations, code generation, testing iterations, and documentation creation. This represents roughly 15-18% of the 200k token budget.
Source Data & APIs
APsystems OpenAPI
Base URL: https://api.apsystemsema.com
Authentication: HmacSHA256 signature-based
Rate Limit: 1,000 requests per day (system uses ~24/day)
Documentation: APsystems OpenAPI User Manual
API Endpoints Used
- System Details:
/user/api/v2/systems/details/{sid}- Retrieves ECU information - Hourly Energy:
/user/api/v2/systems/{sid}/devices/ecu/energy/{eid}- Gets 24-hour production data
Hardware Source
- ECU ID: 216000235705
- Manufacturer: APsystems
- Data Format: Hourly kWh production values (24-element array)
Local Data Storage
- Database: SQLite (solar_data.db)
- Tables: energy_data, api_calls, daily_totals
- Caching Strategy: Permanent storage of historical data, 1-hour refresh for current data
Technical Architecture
Process Documentation
Development Process
- HmacSHA256 signature generation for APsystems authentication
- SQLite database with three tables for data caching
- Rate limiting logic (max 1 API call per hour)
- Smart caching to minimize API usage
- JSON endpoint for frontend data retrieval
- 10-day x 24-hour heat map grid (240 cells)
- Blue gradient color scheme (11 levels based on production)
- Hover tooltips showing exact kWh and timestamp
- Daily totals column on the right
- Daily summary bar chart below heat map
- Dynamic color legend
- Loading states and error handling
Feedback Mechanisms
Interactive User Feedback
- Hover Tooltips: Real-time feedback showing exact kWh and timestamp for any hour
- Color Gradients: Visual feedback on production levels (darker = less, brighter = more)
- Daily Totals: Instant summary of total daily production
- Update Timestamp: Shows when data was last refreshed
- Loading Indicators: Spinner and status message during data fetch
- Error Messages: User-friendly error display if data fetch fails
Technical Feedback Loops
- API Rate Limiting: Automatic throttling prevents exceeding 1000 requests/day limit
- Cache Hit/Miss: Database returns cached data when available, fetches from API only when needed
- Browser Console: Detailed logging for debugging and monitoring
- Server Logs: PHP error logging for API authentication and database issues
Key Technical Challenges Solved
Challenge 1: API Signature Authentication
Problem: Initial API calls returned error 4000 (Request parameter exception)
Solution: Discovered that APsystems API requires the signature to use only the last segment of the request path, not the full path. Updated signature generation logic to:
Learning: Always read API documentation carefully, especially for signature-based authentication. The exact format matters.
Challenge 2: Rate Limiting & Caching
Problem: APsystems limits to 1000 API calls per day. Without caching, the dashboard would quickly exceed this limit with frequent page loads.
Solution: Implemented three-tier caching strategy:
- Historical data cached permanently once retrieved
- Current hour data refreshed only if last API call was >1 hour ago
- API call tracking in database prevents rapid-fire requests
Result: Typical usage: ~24 API calls/day (well within 1000 limit)
Challenge 3: Security Configuration
Problem: API credentials must be kept secure and not exposed to the internet
Solution: Multi-layer security approach:
- .htaccess rules deny direct access to secrets.php and database file
- All API calls go through PHP backend (never from frontend)
- Credentials never appear in JavaScript or HTML source
- Database file permissions restricted to web server user
What Worked Well
- PRD-First Approach: Creating detailed requirements before coding prevented scope creep
- Reference Screenshot: Ashley's visualization provided clear visual target
- API Documentation: Complete API docs made integration straightforward once signature issue resolved
- Incremental Testing: Testing each component (auth, database, caching, UI) separately simplified debugging
- Smart Caching: Rate limiting and caching design worked perfectly on first try
- Responsive Feedback: Numbered feedback files created clear audit trail
Learning Outcomes
For Future Projects
Project Statistics
File Breakdown
- index.html (100 lines) - Dashboard structure and layout
- styles.css (180 lines) - Blue gradient heat map styling
- app.js (280 lines) - Data fetching, rendering, and interactivity
- api.php (320 lines) - Backend API with authentication and caching
- init_db.php (50 lines) - Database initialization script
- secrets.php (15 lines) - API credentials configuration
- .htaccess (15 lines) - Security rules
- README.md (240 lines) - User documentation
- SETUP.md (150 lines) - Quick setup guide
- PROJECT_SUMMARY.md (310 lines) - Technical overview
Performance Metrics
Live Example Data
Real solar production data retrieved from the APsystems ECU:
- 2026-01-06: 40.43 kWh total, peak hour: 6.8 kWh at 1:00 PM
- 2026-01-05: 14.73 kWh total (cloudy day)
- 2026-01-04: 20.40 kWh total
- 2025-12-29: 42.24 kWh total, peak hour: 7.2 kWh (best day in dataset)
Key Takeaways
- Visual references accelerate development: Ashley's screenshot eliminated ambiguity
- Security should be built-in, not bolted-on: Protected credentials from day one
- Smart caching is essential for rate-limited APIs: 24 calls/day vs. potential 1000+
- Comprehensive PRDs prevent scope creep: 11 acceptance criteria kept project focused
- API documentation precision matters: Signature format required exact implementation
- Iterative debugging pays off: Signature issue resolved through systematic testing
Final Thoughts
This project demonstrates the power of AI-assisted full-stack development when combined with clear requirements, visual references, and systematic problem-solving. The dashboard successfully replicates Ashley's visualization while adding interactive features like hover tooltips and daily charts.
The smart caching architecture ensures the system stays well within API rate limits while providing near-instant data retrieval for users. Security measures protect sensitive credentials without complicating the user experience.
From initial concept to production-ready application, the entire development process was completed efficiently through collaboration with Claude Code, resulting in a robust, secure, and performant solar energy dashboard.
View Solar Energy Dashboard